
![]()
Gérard Stehelin, votre eXpertise eXterne
Conseil en technologies avancées :
- Innovation
- Microélectronique
- Photovoltaïque
A votre service, proche de vous.
Besoin d'un expert ? Besoin d'un conseil ?
Je suis à votre écoute pour comprendre votre besoin et vous offrir une solution adaptée.
Mes services
Mon profil

Je totalise plus de 35 ans d’expérience dans le secteur des technologies avancées, avec une grande diversité de fonctions exercées, dont 30 ans chez un fabricant Européen de circuits intégrés, leader au niveau mondial.
Quelques informations
%
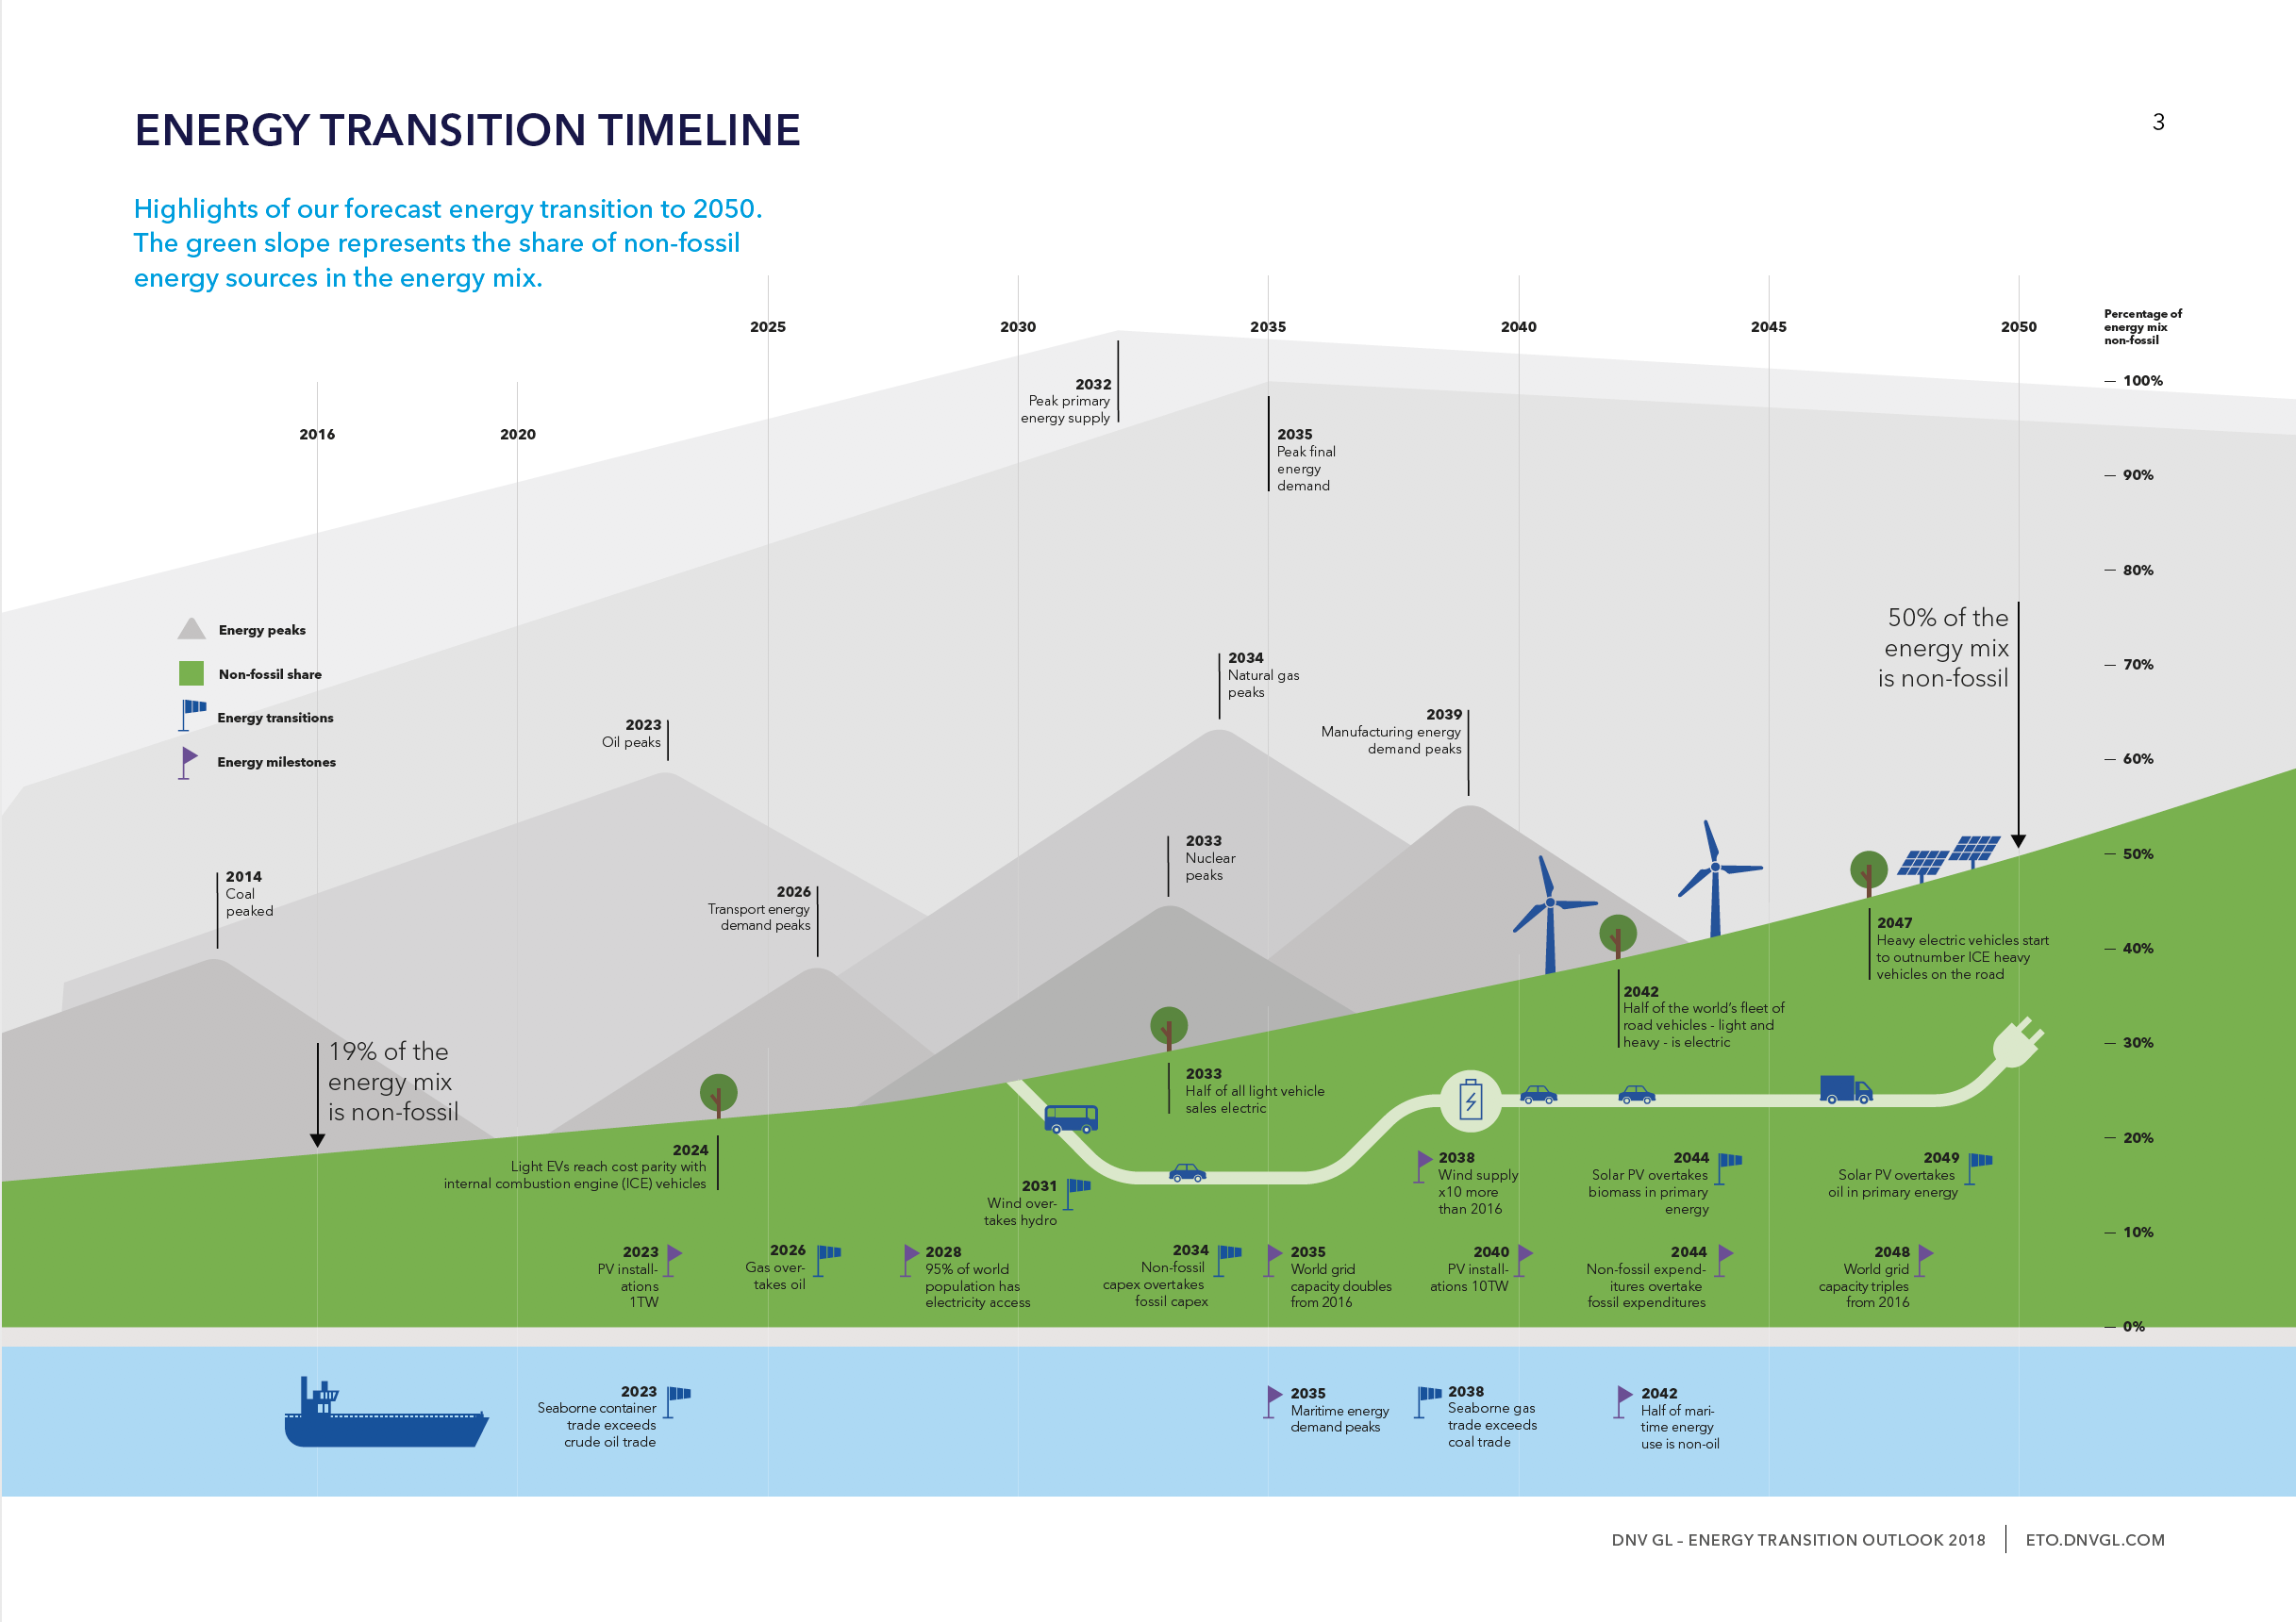
Europe's electricity in 2020 was 29% cleaner than in 2015

Source « Europe’s Power Sector in 2020 », Ember and Energiewende on 25th January 2021
Coal generation fell 20% in 2020, and has halved since 2015. Coal generation fell in almost every country, continuing coal’s collapse that was well in place before Covid-19. Half of the drop in 2020 was due to a decrease in electricity demand, which fell by 4% due to the impact of Covid-19; and half was from additional wind and solar. As electricity demand bounces back in 2021, wind and solar will need to rise at a faster rate if the recent falls in coal are to be sustained.
Gas generation fell only 4% in 2020, despite the pandemic. Most of the fall in fossil was on coal rather than gas in 2020, because a robust carbon price meant gas generation was the cheapest form
of fossil generation, even undercutting lignite for the first time in some months. Nuclear generation fell by 10% in 2020 – probably the largest fall ever – and that also kept gas (and to a lesser-extent coal) generation from falling further.
This means Europe’s electricity in 2020 was 29% cleaner than in 2015. Carbon intensity has fallen from 317 grams of CO2 per kilowatt-hour in 2015 to 226 grams in 2020. Although coal generation has almost halved in that time, 43% of the coal decline has been offset by increased gas generation, slowing the reduction in carbon intensity.
%
The world is awful. The world is much better. The world can be much better.It is wrong to think that these three statements contradict each other. We need to see that they are all true to see that a better world is possible.
%
Historians estimate that in the past around half of all children died before they reached the end of puberty. This was true no matter where in the world a child was born and it only started to change in the 19th century, just a few generations ago.
%
The world region where children have the best chance of surviving childhood is the European Union. 99.55% of all children born in the EU survive childhood. Source Our World in Data, July 2022.

Deaths rate for coal from accidents and air pollution by TWh of energy
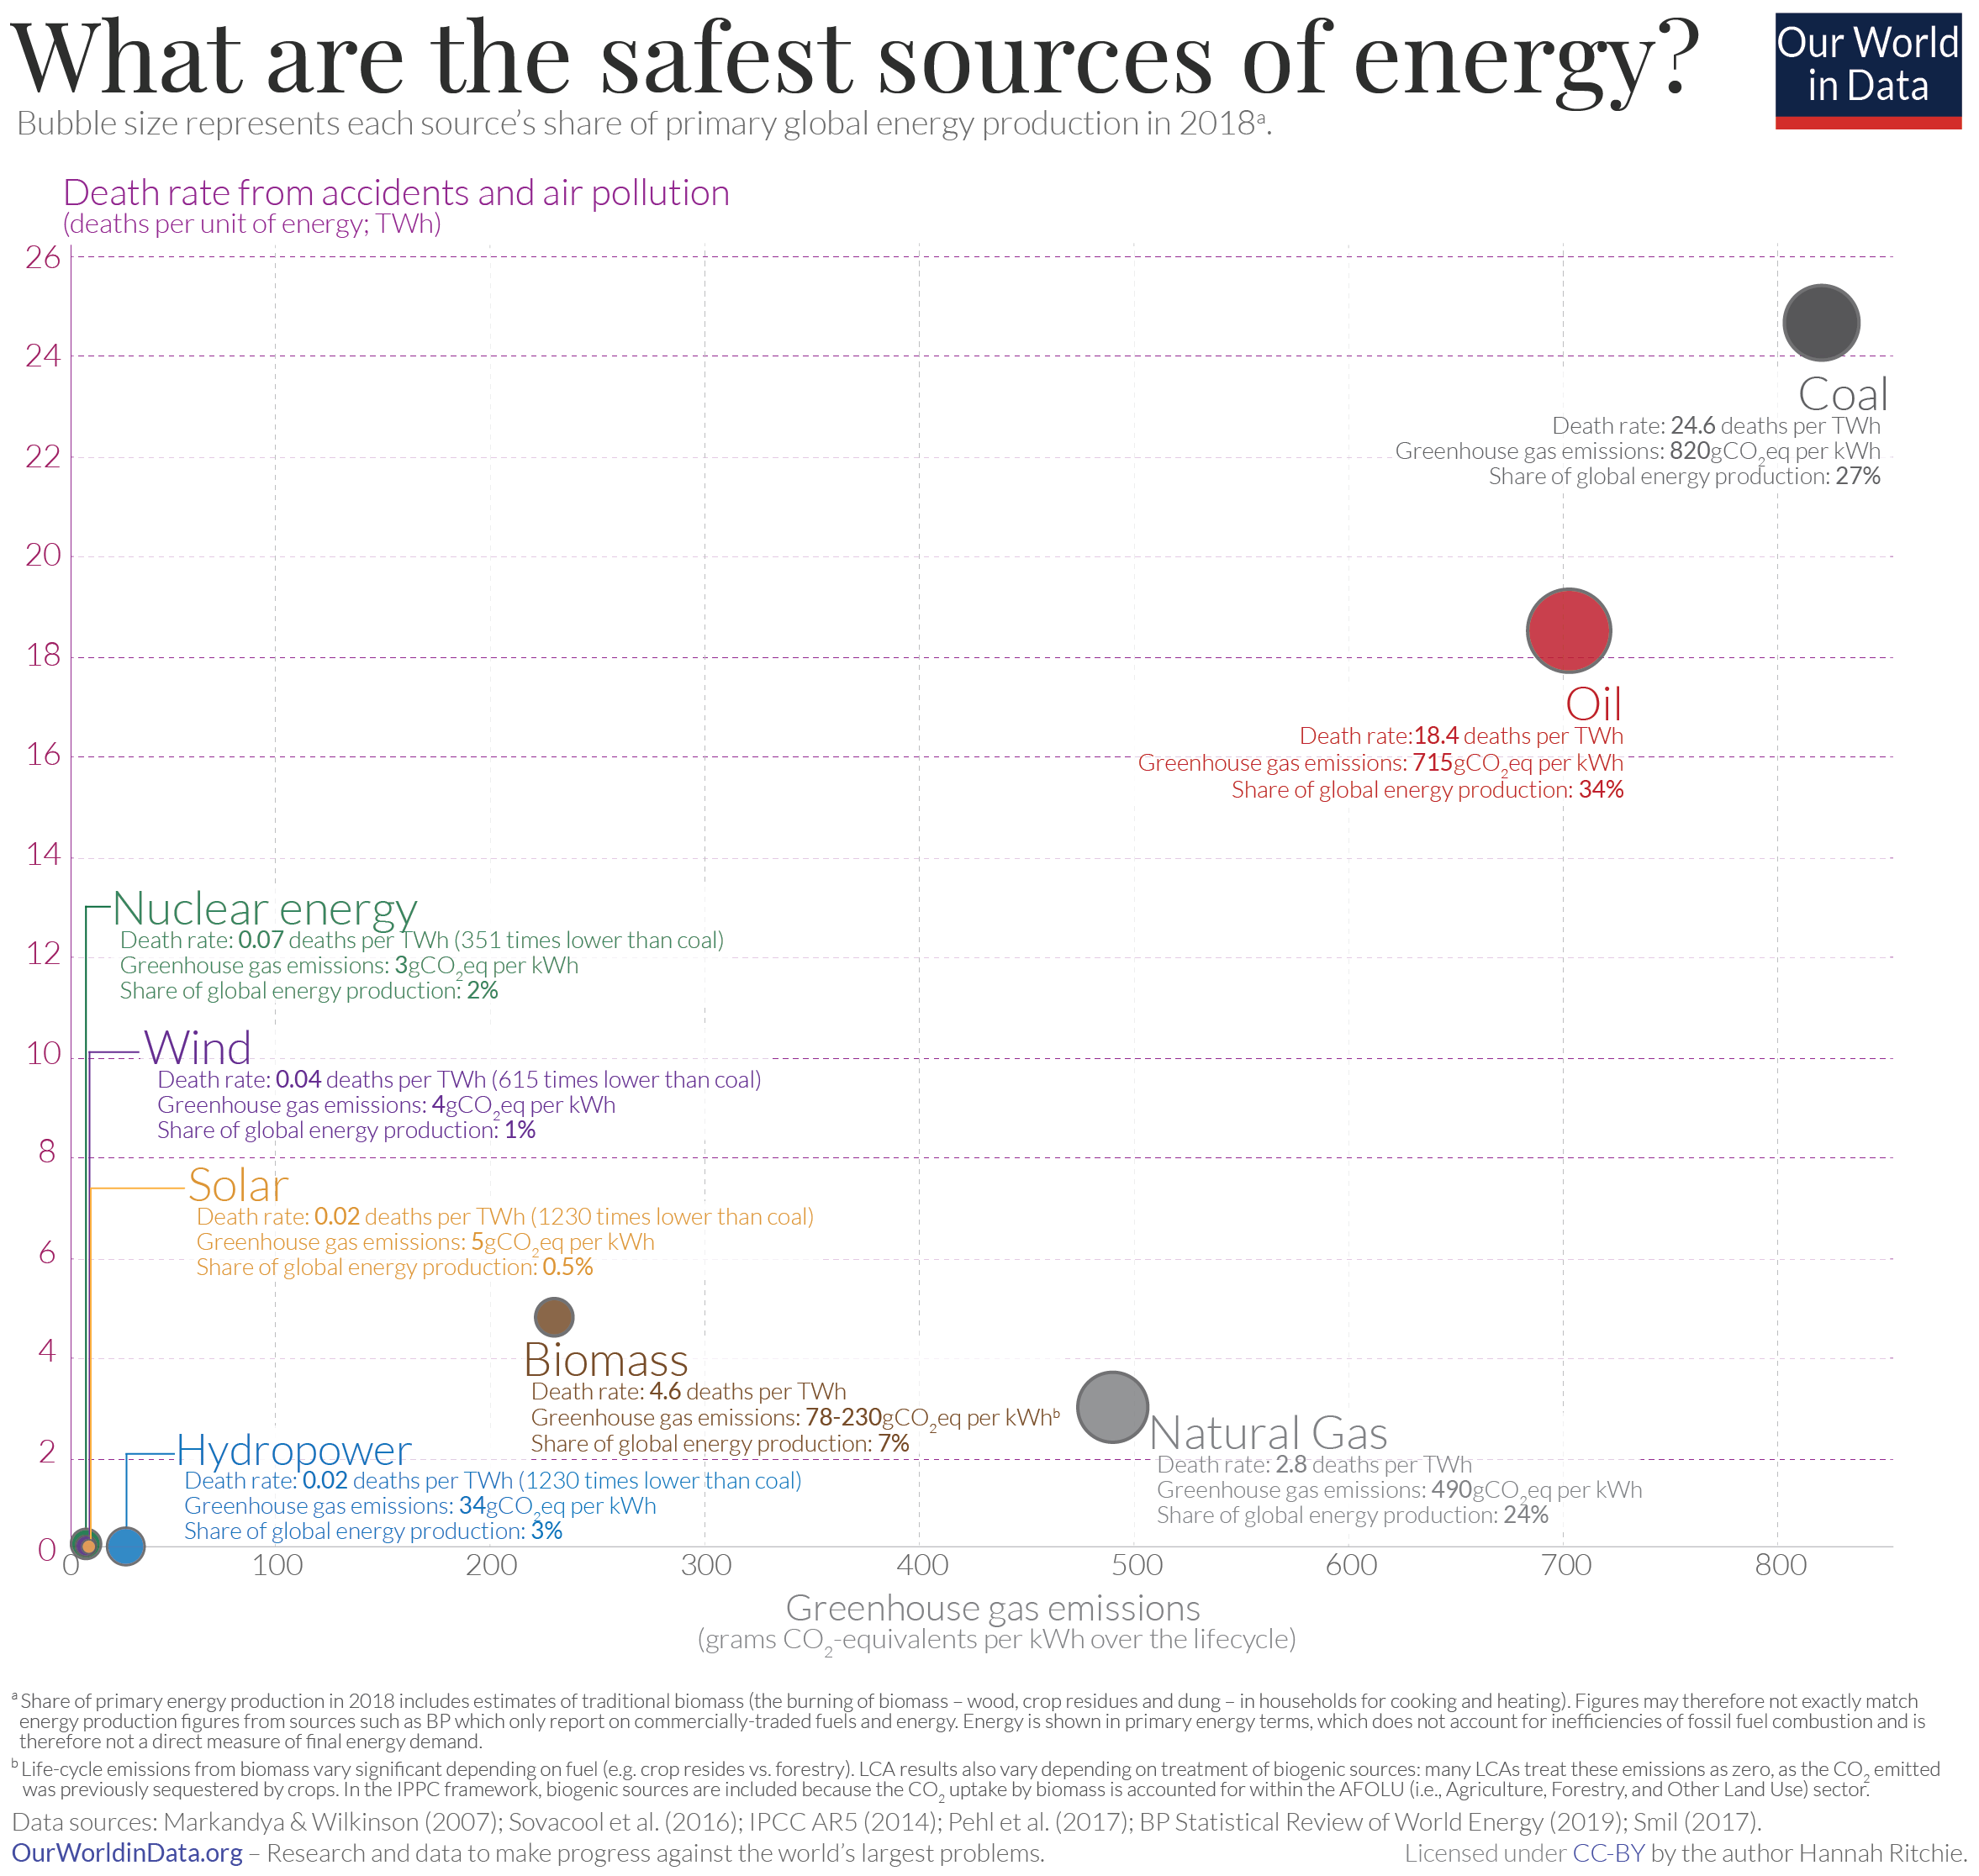
What are the safest sources of energy?
Souce: Our World in Data, 17 March 2020
The good news is that the safest sources are those which are low-carbon.
This measure of greenhouse gas emissions considers the total carbon footprint over the full lifecycle; figures for renewable technologies, for example, take into consideration the footprint of the raw materials, transport and their construction.
The size of each bubble represents its share of global primary energy production in 2018 (including traditional biomass in the total).
Nuclear, wind, hydropower and solar energy all cluster in the bottom-left of the chart. They are all safe, low-carbon options. But they still account for a very small share of global energy consumption – less than 10% of primary energy – as we see from the bubble size.